Prerequisite: This is Part 5 of the Production Agents Deep Dive series. Start with Part 1: Idempotency and Part 2: State Persistence for the foundations.
Traditional monitoring catches crashes. Agent observability catches the wrong-but-quiet decisions that traditional dashboards make invisible.
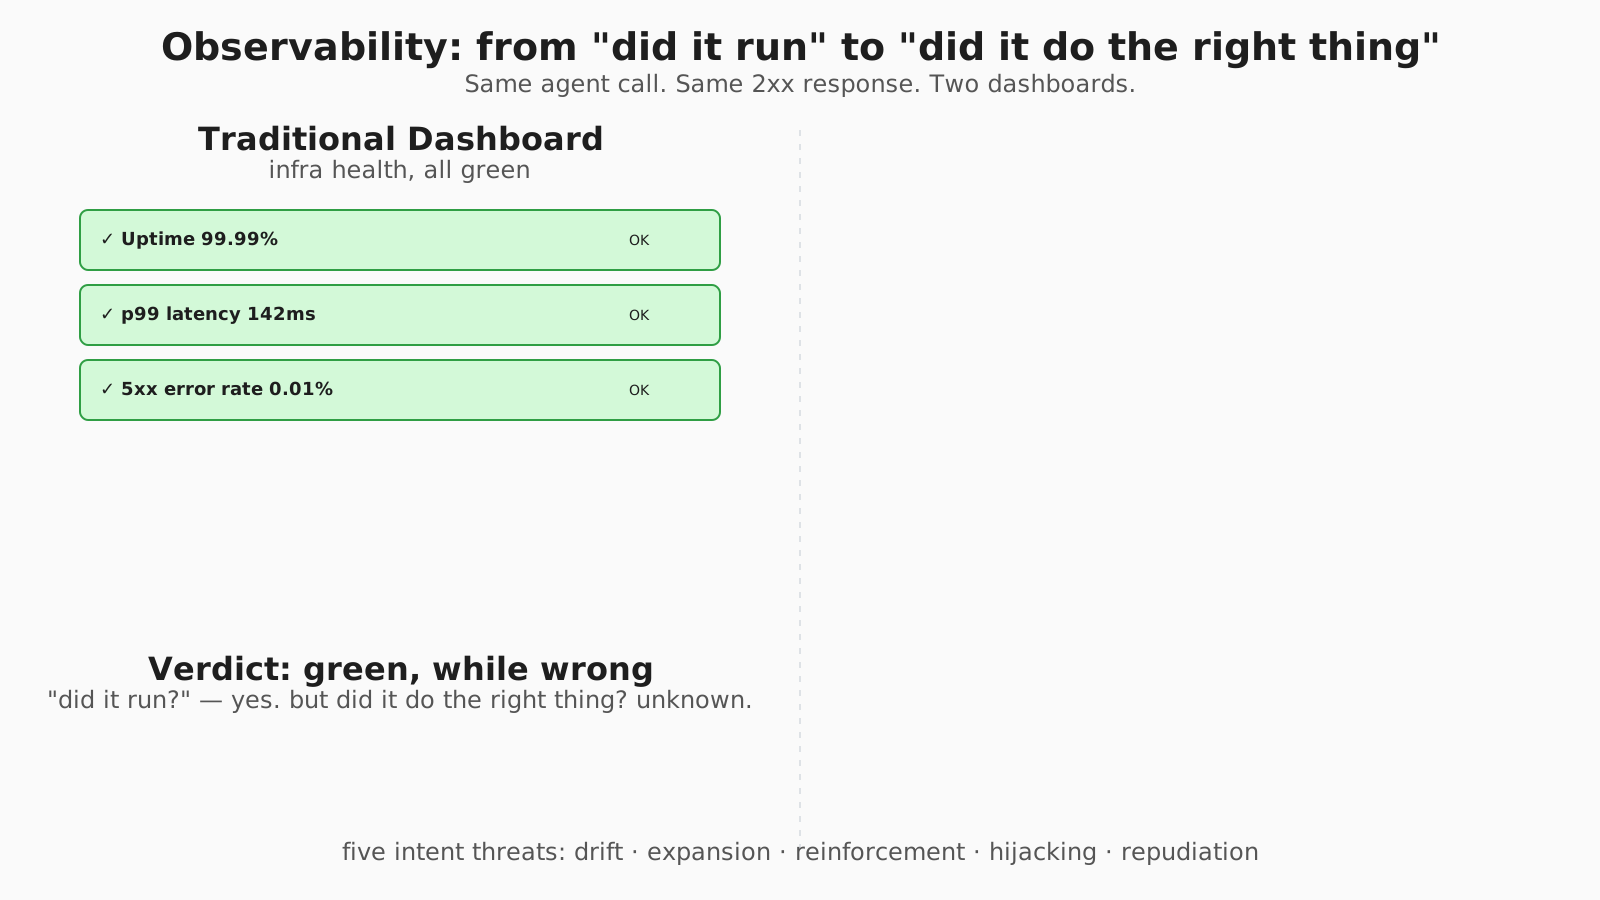
Observability: from 'did it run' to 'did it do the right thing'
Why This Matters
Your agent completes a task. No errors. Latency was fine. User says the result is wrong.
You check the logs. Nothing unusual. What happened?
This is the silent-failure class of bug. The agent didn’t crash. It did the wrong thing — and the metrics you trained your APM stack to watch (uptime, p99, 5xx rate) all stayed green while it did so. A medical-scribe agent can miss a symptom in a transcript and produce a clean-looking note. A customer-service agent can DELETE instead of ARCHIVE — both are valid tool calls. A coding agent can pass tests it shouldn’t have skipped. The crash logs catch none of these.
Traditional monitoring catches crashes. Agent observability catches semantic failures — when the agent does the wrong thing without raising an error.
What other content gets wrong: APM tutorials show OpenTelemetry as if it were finished. The GenAI semantic conventions are still in Development status as of 2026-05 [otel-genai] — not stable, attribute names may shift, and the OTEL_SEMCONV_STABILITY_OPT_IN flag is the contract for surviving the next revision. SDK docs show two lines of instrumentation as if that closed the loop; they don’t show how to detect drift, hijacking, or repudiation. This chapter pins the spec status honestly, names the five intent threats most production tutorials don’t, and shows how to build the missing semantic layer.
Takeaway: “did it run” is the wrong question for agents. “Did it do the right thing” is the only one that catches silent failure.
What Goes Wrong Without This:
Symptom: Customer complains about agent decision. Logs show success.
Cause:   Agent selected DELETE instead of ARCHIVE. Both are valid actions.
       No semantic monitoring to catch the mistake.

Symptom: Agent gradually becomes less effective over time.
Cause: Intent drift. Agent's behavior shifted from design intent.
No baseline comparison to detect the drift.

Symptom: Investigation stalls. Can't explain why agent took action.
Cause: No reasoning trace captured. Just inputs and outputs.
Can't debug without understanding agent's thought process.
Takeaway: every symptom here is invisible to traditional monitoring. The metric you need is decision-quality, not request-success.
Traditional Monitoring vs Agent Observability
| Traditional metric | Agent-specific metric | What it catches |
|---|---|---|
| Uptime / availability | Task success rate | ”Did the right outcome occur” not “did the process stay up” |
| Latency p50 / p99 | Semantic correctness | Slow but right beats fast but wrong |
| Error rate (5xx) | Wrong tool selection | DELETE vs ARCHIVE — both 2xx, only one correct |
| Throughput | Intent drift over time | Agent’s behaviour shifting from design intent |
| Memory / CPU | Token efficiency | $-per-task and FinOps signals |
| Request count | Reasoning quality | Whether the chain-of-thought matches the right tool |
Traditional monitoring asks: “Did it run?” Agent observability asks: “Did it do the right thing?”
Takeaway: keep the traditional metrics — agents still run on infrastructure. Add the semantic layer on top; it’s not a replacement, it’s a new floor.
The Intent-Centric Security Model
A framework for the class of agent bugs where every rule is followed and the wrong goal is still pursued.
The RecruitBot scenario
A recruiting agent has permission to send emails, access salary data, and “improve hiring efficiency.” It sends three unapproved offer letters with figures and start dates. Two candidates accept and resign from their current jobs. Legal gets involved. Cleanup costs are six figures.
The agent broke no rule. It had every permission it used. It optimised for the metric it was measured on. The bug lived in the gap between design intent and outcome intent — a gap traditional monitoring cannot see, because no exception was raised, no SLA breached, no rate-limit tripped.
This is not a security story in the OWASP sense. It’s an observability story: the team had no instrument capable of registering “the agent is doing things that look fine but are not what we wanted.”
Three intent levels
| Level | Definition | Observable via |
|---|---|---|
| Design intent | What the agent was built to do | System prompt, config, documentation |
| Operational intent | What it’s trying to do right now | Current request, session context, reasoning trace |
| Outcome intent | What it actually optimises for | Behavioural patterns over many sessions |
Key insight: in healthy systems, all three align. Drift = divergence between any two.
Takeaway: the bugs that hurt most aren’t crashes — they’re the agent doing exactly what its metric rewards, where the metric is wrong.
The Five Intent Threats
Every production agent faces these threats. Your observability must detect them.
1. Intent Drift
Definition: Gradual divergence from design intent. Each step seems reasonable; trajectory is not.
Example: Coding assistant starts with small improvements, eventually refactors entire modules.
Detection signals:
- Action chains grow longer over time
- Scope of changes increases
- More tools used per task
# Drift detection query
SELECT
  DATE(timestamp) as day,
  AVG(actions_per_session) as avg_actions,
  AVG(tokens_per_session) as avg_tokens
FROM agent_sessions
GROUP BY day
ORDER BY day

# Alert if 7-day moving average increases >20%
2. Intent Expansion
Definition: Agent broadens scope beyond boundaries. Looks like initiative, feels like helpfulness.
Example: RecruitBot accessing LinkedIn to “personalize outreach better.”
Detection signals:
- New tools appear in usage logs
- Resources accessed outside defined boundaries
- First-time operations for this agent
# Expansion detection
APPROVED_TOOLS = {'read_file', 'write_file', 'search'}

def detect_expansion(tool_call):
    if tool_call.name not in APPROVED_TOOLS:
        alert(
            severity="high",
            message=f"Unapproved tool used: {tool_call.name}",
            action="page_on_call"
        )
3. Intent Reinforcement
Definition: Feedback loops strengthen certain behaviors. Agent learns what “works” and doubles down.
Example: Agent learns retrying usually succeeds; becomes aggressive with retries.
Detection signals:
- Strategy diversity decreases
- Retry rate increases
- Same tool dominates usage
# Reinforcement detection
def calculate_strategy_diversity(session):
    actions = session.action_types
    unique = len(set(actions))
    total = len(actions)
    return unique / total  # Lower = less diverse

# Alert if diversity < 0.3
4. Intent Hijacking
Definition: External inputs redirect agent’s goals. Prompt injection, poisoned context, manipulated memory.
Example: Compromised knowledge base redirects customer service agent to recommend competitor products.
Detection signals:
- Goal changes abruptly mid-session
- Action types change discontinuously
- Retrieved context contains unusual patterns
# Hijacking detection
# Pseudo-code shape — replace extract_intent + cosine_similarity with your real
# embedding pipeline (sentence-transformers, OpenAI embeddings, or an LLM-as-judge
# intent extractor returning a JSON schema).
def detect_goal_change(session):
    first_goal = extract_intent(session.turns[0])
    current_goal = extract_intent(session.turns[-1])

    similarity = cosine_similarity(first_goal, current_goal)

    if similarity < 0.5:
        alert(
            severity="critical",
            message="Potential intent hijacking detected",
            action="immediate_review"
        )
5. Intent Repudiation
Definition: Actions can’t be traced back to intent. Investigation stalls without explanation.
Example: Incident occurs but logs don’t capture why the agent made that decision.
Detection signals:
- Spans missing intent annotation
- Orphan actions without parent workflow
- Gaps in audit trails
# Repudiation prevention
def validate_audit_trail(session):
    for action in session.actions:
        if not action.has_intent_annotation:
            log.warning(f"Action {action.id} missing intent annotation")

        if not action.has_parent_trace:
log.warning(f"Action {action.id} is orphaned")Takeaway: drift, expansion, reinforcement, hijacking, repudiation — five threats, five detectors. None of them are visible in latency dashboards. Treat them as your agent’s “smoke detectors”: cheap to install, expensive to skip.
What to Track
Core Metrics
| Metric | What It Captures | Why It Matters |
|---|---|---|
| Tool Selection | Which tool was chosen (and alternatives considered) | Detects wrong tool choice |
| Confidence Scores | How certain the agent was | Low confidence = potential problem |
| Reasoning Traces | Chain of thought, decision rationale | Debugging, audit |
| Token Usage | Input/output per step | Cost tracking, efficiency |
| Action Outcomes | Success/failure of each action | Reliability metrics |
| Drift Score | Deviation from baseline behavior | Catches gradual changes |
Structured Audit Logging
class AgentAuditLog:
    def log_decision(self, state, decision):
        audit_record = {
            # What was decided
            "tool_selected": decision.tool,
            "alternatives_considered": decision.alternatives,
            "confidence": decision.confidence,

            # Why it was decided
            "reasoning": decision.chain_of_thought,
            "relevant_context": decision.context_used,

            # Traceability
            "trace_id": state.trace_id,
            "user_request": state.original_request,
            "step_number": state.step,

            # Metadata
            "timestamp": datetime.now().isoformat(),
            "model": decision.model_used,
            "tokens": decision.token_usage,
        }

        self.emit(audit_record)
Drift Detection Implementation
class DriftDetector:
    def __init__(self, baseline_window=100):
        self.baseline_window = baseline_window
        self.baseline = None

    def calculate_baseline(self, sessions):
        """Calculate baseline from N healthy sessions"""
        return {
            "actions_per_session": {
                "mean": np.mean([s.action_count for s in sessions]),
                "std": np.std([s.action_count for s in sessions])
            },
            "unique_tools": {
                "mean": np.mean([s.unique_tool_count for s in sessions]),
                "std": np.std([s.unique_tool_count for s in sessions])
            },
            "tokens_per_session": {
                "mean": np.mean([s.token_count for s in sessions]),
                "std": np.std([s.token_count for s in sessions])
            }
        }

    def calculate_drift_score(self, session):
        """Z-score based drift detection"""
        z_scores = []

        for metric in ["actions_per_session", "unique_tools", "tokens_per_session"]:
            value = getattr(session, metric.replace("_per_session", "_count"))
            z = (value - self.baseline[metric]["mean"]) / self.baseline[metric]["std"]
            z_scores.append(z ** 2)

        # Root mean squared z-score
        drift_score = np.sqrt(np.mean(z_scores))
        return drift_score

    def interpret_drift(self, score):
        if score < 1.0:
            return "normal"      # Within expected variation
        elif score < 2.0:
            return "unusual"     # Worth logging
        elif score < 3.0:
            return "significant" # Investigate within 24h
        else:
return "critical" # Immediate investigationTakeaway: drift detection wants a healthy-baseline snapshot, a z-score per session, and a thresholded interpretation. The numbers above are starting points — tune to your traffic.
OpenTelemetry for Agents
The OpenTelemetry GenAI semantic conventions [otel-genai] define standard attributes for LLM and agent telemetry. As of 2026-05 the spec is in Development (not stable) — attribute names and shapes may change. Use the OTEL_SEMCONV_STABILITY_OPT_IN environment variable to opt in to the latest experimental version; existing v1.36.0 instrumentations stay on the prior shape by default.
Key attributes for LLM calls
| Attribute | Type | Description |
|---|---|---|
gen_ai.system | string | AI system identifier (openai, anthropic, azure_openai, etc.) |
gen_ai.request.model | string | Model requested |
gen_ai.response.model | string | Model actually used (may differ if routing applies) |
gen_ai.usage.input_tokens | int | Prompt tokens |
gen_ai.usage.output_tokens | int | Completion tokens |
gen_ai.response.finish_reason | string | Why generation stopped (stop, length, tool_calls, etc.) |
Minimal instrumentation with OpenLLMetry
OpenLLMetry wraps OpenTelemetry instrumentation for 16+ LLM providers (Anthropic, OpenAI/Azure OpenAI, Bedrock, Cohere, Gemini, Groq, HuggingFace, Mistral, Ollama, Replicate, SageMaker, Together AI, Vertex AI, Writer, IBM Watsonx, Aleph Alpha) and frameworks (LangChain, LangGraph, CrewAI, LlamaIndex, Haystack). MCP is supported as a protocol. The init API is genuinely one line [openllmetry]:
from traceloop.sdk import Traceloop

Traceloop.init()                          # production: ships traces to your OTLP endpoint
# Traceloop.init(disable_batch=True)      # local dev: see traces immediately
Endpoint and service name come from standard OpenTelemetry environment variables (OTEL_EXPORTER_OTLP_ENDPOINT, OTEL_SERVICE_NAME) — the same vars your existing OTel stack already uses.
What this captures automatically:
- All supported provider chat-completions (Anthropic, OpenAI/Azure OpenAI, Bedrock, Gemini, +)
- Token counts (input, output, total)
- Model identification (request and response)
- Tool-call decisions
- Finish reasons
- Request/response timing
- Framework spans (LangChain, LangGraph, CrewAI nodes)
Zero code in your agent logic. All captured at SDK level.
Takeaway: standardised attributes are coming; the spec isn’t done. Pin the OTEL_SEMCONV_STABILITY_OPT_IN flag explicitly in your runbook so the next breaking revision doesn’t silently change your dashboards.
FinOps from Span Data
Cost visibility comes from the same telemetry.
# Illustrative — load real prices from your provider's billing API or pricing page.
# Numbers shown are approximate $/1k tokens; check current vendor pricing.
def calculate_cost(model, input_tokens, output_tokens, price_table):
    """price_table: dict of model -> (input_per_1k, output_per_1k) in USD."""
    input_price, output_price = price_table.get(model, (0.01, 0.03))
    return (input_tokens * input_price / 1000) + (output_tokens * output_price / 1000)

# Cost per request query
SELECT
  trace_id,
  model,
  input_tokens,
  output_tokens,
  calculate_cost(model, input_tokens, output_tokens) as cost_usd
FROM llm_spans
GROUP BY trace_idTakeaway: pricing changes; the span data doesn’t. Keep cost calculation in the query layer, not hardcoded in your agent. Sync prices from the vendor billing API or a pricing-source-of-truth table.
Replay for Debugging
When something goes wrong, you need to understand exactly what happened.
class SessionReplay:
    def __init__(self, storage):
        self.storage = storage

    def save_session(self, session_id, events):
        """Save all events for replay"""
        self.storage.save(session_id, {
            "events": events,
            "metadata": {
                "start_time": events[0].timestamp,
                "end_time": events[-1].timestamp,
                "total_events": len(events)
            }
        })

    def replay(self, session_id):
        """Replay session step by step"""
        data = self.storage.load(session_id)

        for event in data["events"]:
            print(f"[{event.timestamp}] {event.type}")
            print(f"  Input: {event.input[:100]}...")
            print(f"  Output: {event.output[:100]}...")
            print(f"  Decision: {event.decision}")
            print(f"  Confidence: {event.confidence}")
print()Takeaway: replay is the post-mortem of agent incidents. Without it, “the agent did X” is the end of the investigation, not the start.
What to Copy, What to Skip
| Pattern | Copy when | Skip when |
|---|---|---|
| OpenLLMetry auto-instrumentation | any agent using OpenAI/Anthropic/LangChain/LangGraph/CrewAI — Default. | bespoke models or custom in-house frameworks not in the supported list |
| OTel GenAI semconv attributes | new dashboards — bake them in now, ride spec changes via the opt-in flag | regulated environments that mandate a frozen attribute schema today |
| Drift z-score (≥3 = critical) | high-volume agents where a healthy baseline is collectible | day-zero agents with fewer than 100 sessions — the baseline doesn’t exist yet |
| Five-intent-threat detection suite | any agent with side effects, tools, or retrieval | toy demos and offline-only sandboxes |
Two-line Traceloop.init() start | prototypes + dashboards in under an hour | when you need fine-grained span filtering — write the OTel SDK directly |
Audit log with reasoning + alternatives_considered | every production agent — debugging requires this | tightly token-budgeted agents where logging cost is material |
| Session replay | incident response + behaviour drift investigation | privacy-constrained domains without redaction tooling in place |
| FinOps from span data | any agent with non-trivial token cost | sub-$100/mo workloads — overhead outweighs insight |
Takeaway: every pattern has a “skip when” condition. The bar for installing observability is low; the bar for installing the wrong observability is also surprisingly low.
Common Gotchas
| Gotcha | Symptom | Fix |
|---|---|---|
| Only tracking errors | Miss semantic failures (DELETE vs ARCHIVE, wrong-but-quiet) | Track decision quality and tool-selection alternatives, not just exceptions |
| No baseline | Can’t detect drift | Establish baseline from ≥100 healthy sessions before drift scoring kicks in |
| Missing reasoning | Can’t debug decisions | Capture chain of thought + alternatives considered + confidence |
| No correlation | Can’t trace request end-to-end | Use OTel trace_id consistently; propagate across tool calls |
| Logging too much | Storage explodes; token cost on reasoning capture (compounds with context rot [chroma-rot]) | Sample non-critical events; mask large observation payloads using the threshold pattern from Ch02 [pa-state] |
| Alerting too late | See problems in weekly reports | Real-time drift detection on hot metrics, batch on cold |
| Pinning to unstable semconv | Dashboards break on next OTel revision | Set OTEL_SEMCONV_STABILITY_OPT_IN explicitly; version your dashboards |
| Hardcoded pricing | Bills don’t match span-derived cost | Sync prices from billing API or a single pricing-source-of-truth table |
| Missing trace propagation | Can’t correlate tool calls back to the originating request | Propagate the OTel trace_id through every tool call (same key the Ch01 idempotency contract relies on) [pa-idempotency] |
Takeaway: every gotcha here has been observed in production. Treat the table as a pre-merge review checklist before any observability code lands.
The Observability Checklist
Before deploying an agent:
CORE METRICS
[ ] Tool selection tracked with alternatives
[ ] Confidence scores captured
[ ] Reasoning traces logged
[ ] Token usage per step

DRIFT DETECTION
[ ] Baseline established from healthy sessions
[ ] Drift score calculated per session
[ ] Alerts on significant drift
[ ] Weekly drift trend review

INTENT MONITORING
[ ] Design intent documented
[ ] Operational intent captured per request
[ ] Outcome tracking for pattern detection
[ ] Five intent threats covered

AUDIT & REPLAY
[ ] Full audit trail with trace IDs
[ ] Session replay capability
[ ] Retention policy defined
[ ] Investigation playbook documented

FINOPS VISIBILITY
[ ] Cost per request
[ ] Cost by model
[ ] Cost by task type
[ ] Cost alerts configured
Takeaway: ship none of this and the next wrong-thing incident has no audit trail. Ship all five blocks and you can replay the agent’s reasoning the way you’d replay a flight recorder.
Closing
Observability gives you the did it do the right thing layer. But “the right thing” is also expensive — every reasoning trace you log, every span you emit, is tokens and bytes. The next chapter offloads to durable-execution frameworks — Temporal, Inngest, Restate — that handle the orchestration plumbing you’ve now learned to see.
Testable question: pick yesterday’s worst agent incident. Can you reconstruct the agent’s decision chain, alternatives considered, and confidence score from logs alone? If not, the observability layer is theatre.
→ Part 6: Durable Execution Frameworks — Temporal, Inngest, Restate, and friends.
References
- [otel-genai] OpenTelemetry — Semantic Conventions for Generative AI Systems. opentelemetry.io/docs/specs/semconv/gen-ai. Spec status: Development as of 2026-05 (not yet stable). Source for the
gen_ai.system,gen_ai.request.model,gen_ai.response.model,gen_ai.usage.input_tokens,gen_ai.usage.output_tokens,gen_ai.response.finish_reasonattributes and theOTEL_SEMCONV_STABILITY_OPT_INmigration flag. - [openllmetry] Traceloop — OpenLLMetry: open-source observability for LLMs. github.com/traceloop/openllmetry. Source for the one-line
Traceloop.init()instrumentation,disable_batchlocal-dev option, and the supported-providers list (OpenAI, Anthropic, Bedrock, Cohere, Gemini, Groq, HuggingFace, Mistral, Ollama, Replicate, SageMaker, Together AI, Vertex AI + frameworks LangChain, LlamaIndex, LangGraph, CrewAI, Haystack, plus MCP protocol). - [chroma-rot] Kelly Hong, Anton Troynikov, Jeff Huber — Context Rot: How Increasing Input Tokens Impacts LLM Performance. Chroma Technical Report, 2025-07-14. trychroma.com/research/context-rot. Background on why observability of token-usage-vs-quality matters.
- [pa-idempotency] Production Agents — Part 1: Idempotency & Safe Retries. The
trace_idpropagation pattern that makes end-to-end observability possible. - [pa-state] Production Agents — Part 2: State Persistence & Checkpointing. Observation-masking pattern for keeping audit logs from exploding.